 |
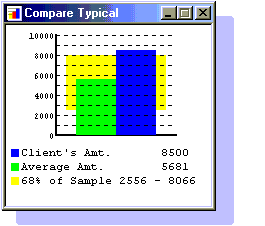
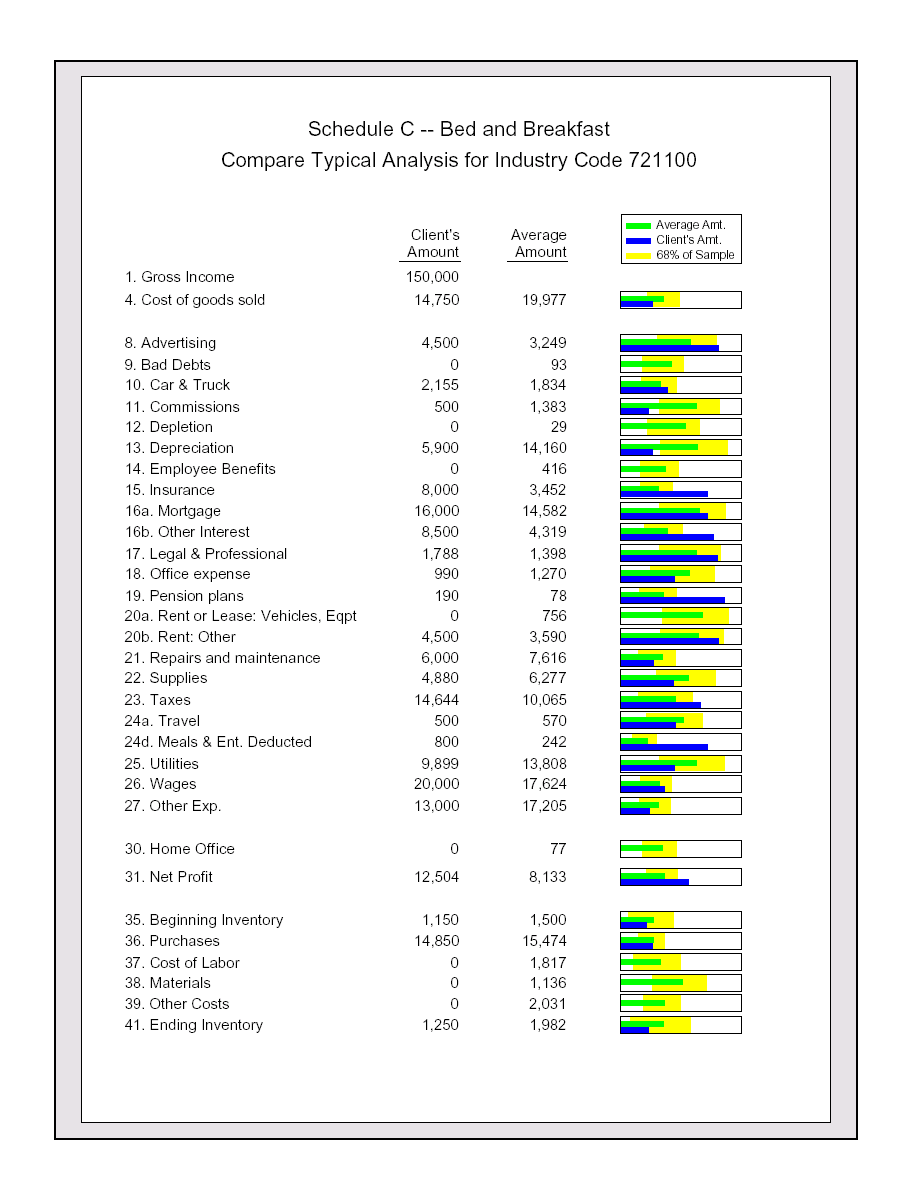
Sharp Software has developed a database of "Compare Typical" data to compare your client's return to national averages on Schedules A, C and E. This extensive database contains unique values for each income range on Schedule A, and for each business code and income range on Schedule C. This is the graph that pops up for state income taxes on Schedule A for a client with an AGI of $125,000. You can print a complete report for Schedules A, C and E to give to your clients (see sample below), or just use it for internal review. |
